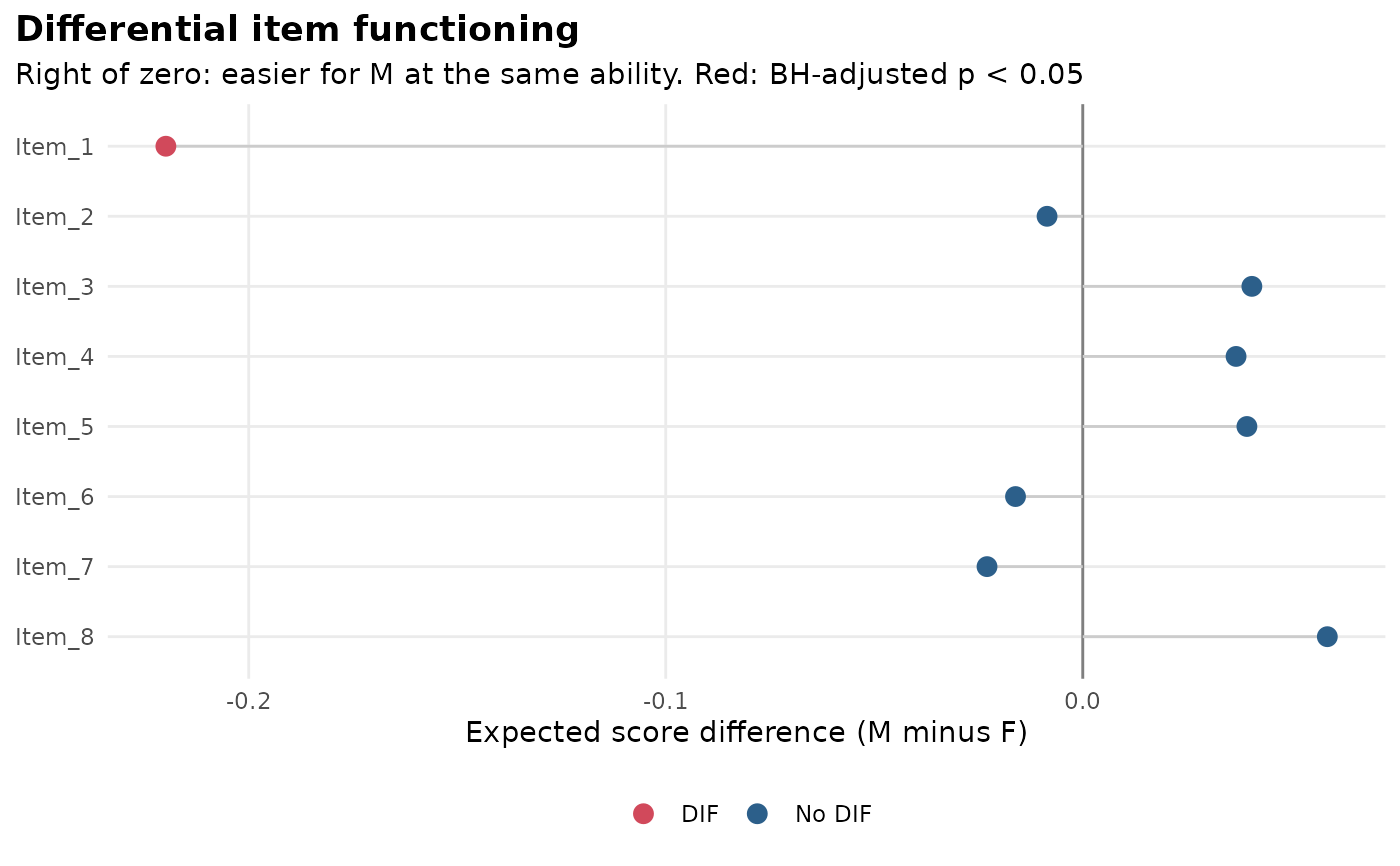
type = "effect" shows the signed expected-score difference for each item,
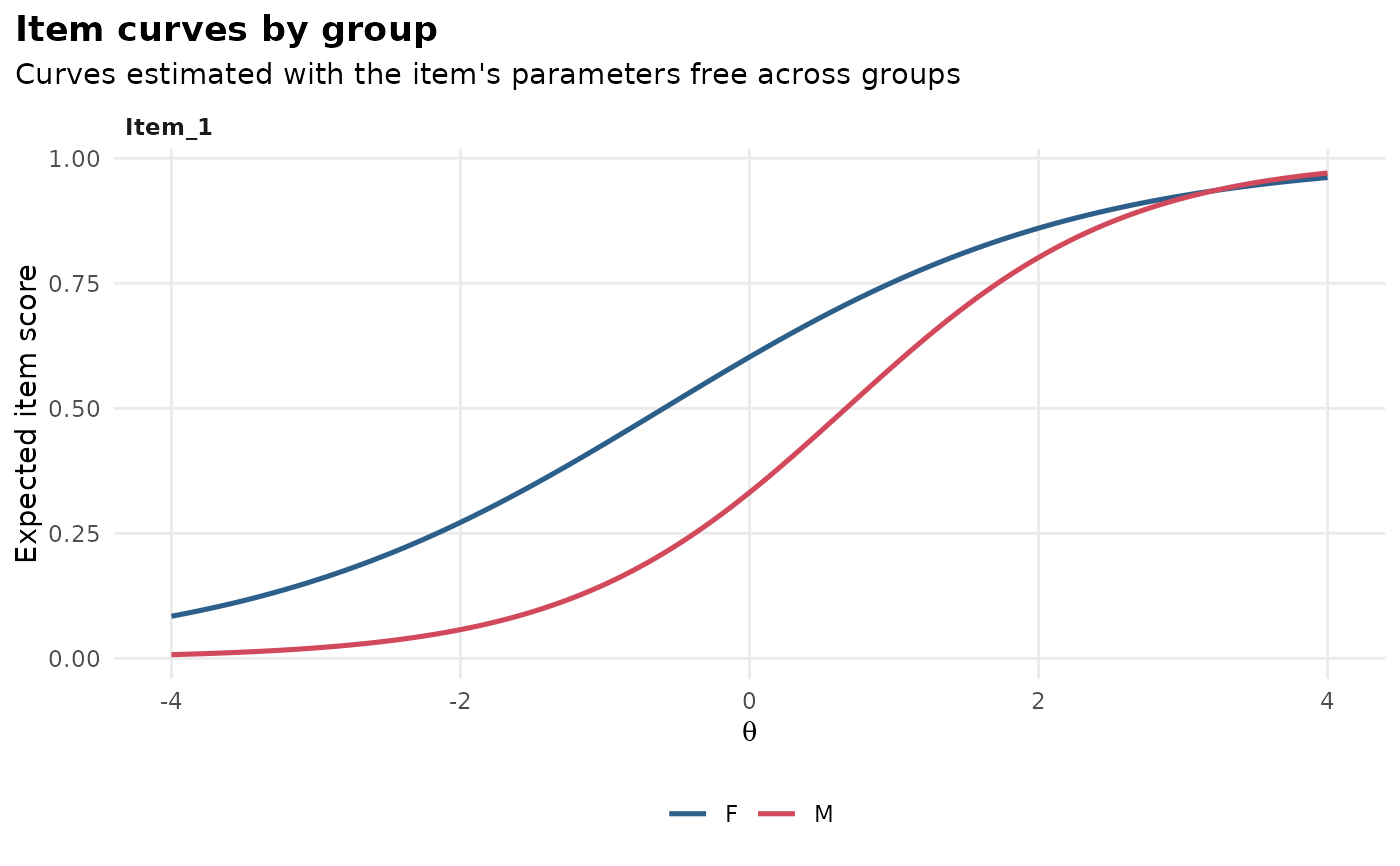
with flagged items highlighted; type = "curves" overlays the expected item
score curves of each group for the chosen (by default the flagged) items.
Arguments
- x
an
mv_difobject fromdif().- type
"effect"or"curves".- which.items
items to draw for
type = "curves", by name. Defaults to the flagged items, or the item with the largest effect if none is flagged.- theta_lim
range of the latent trait for
type = "curves".