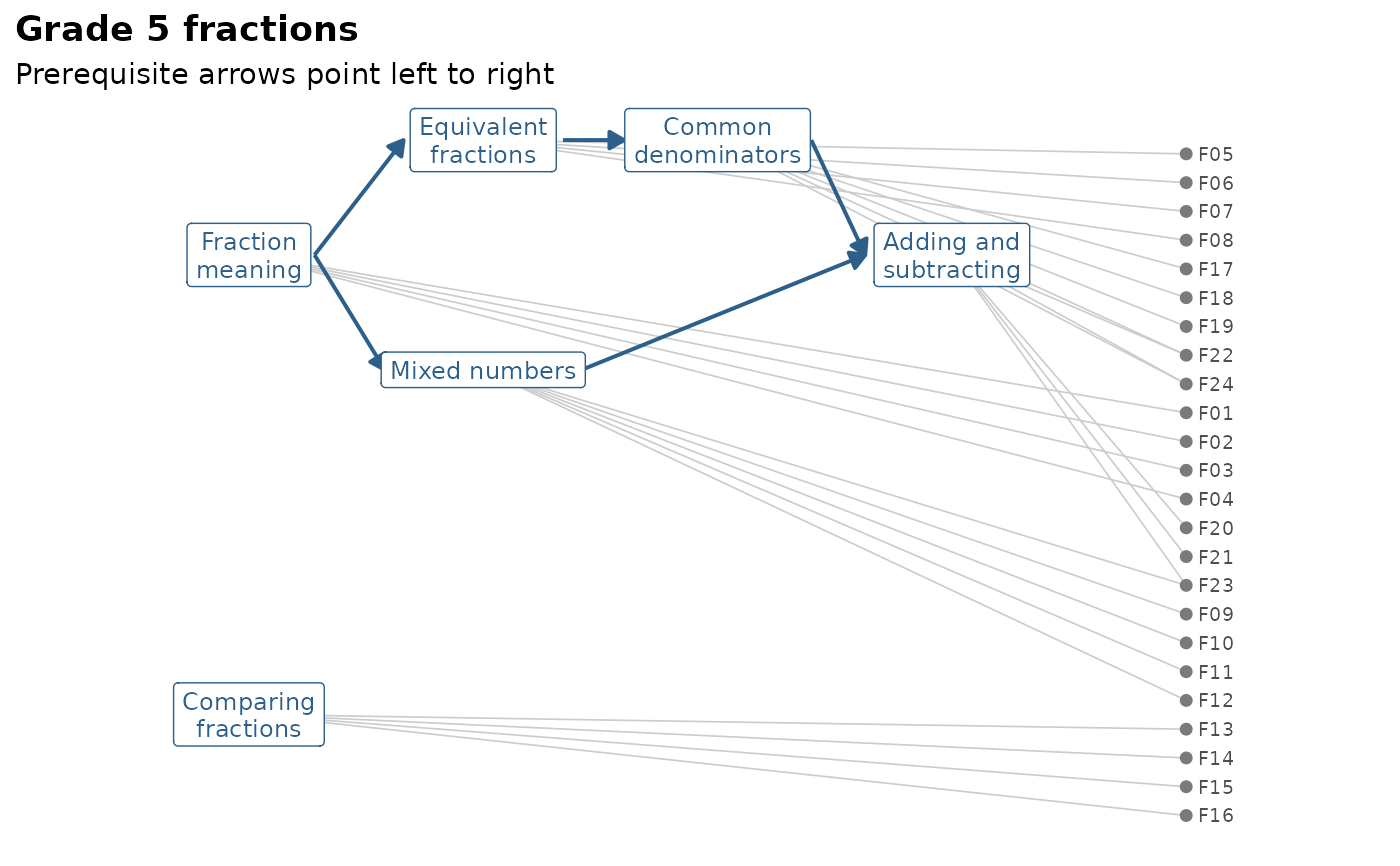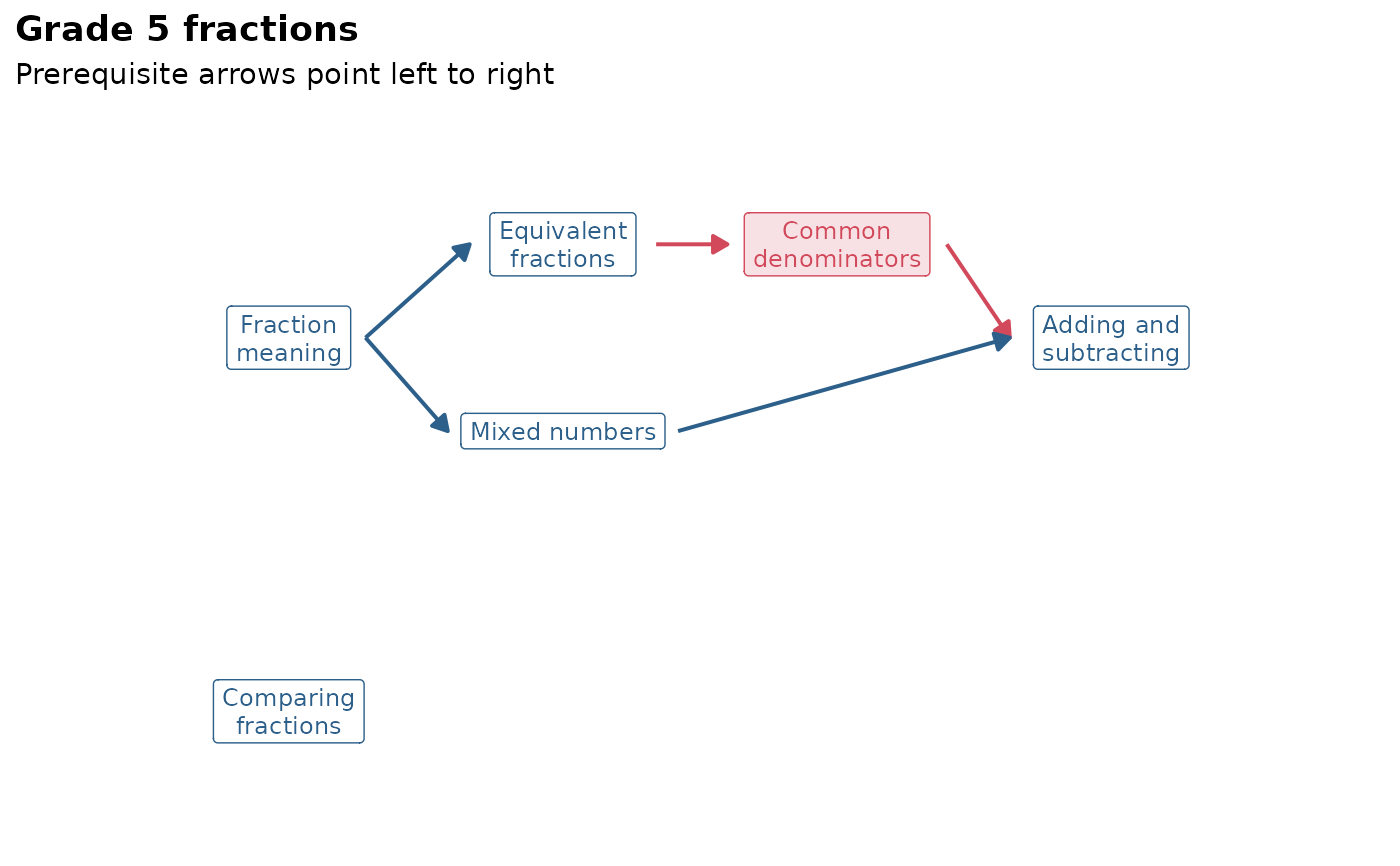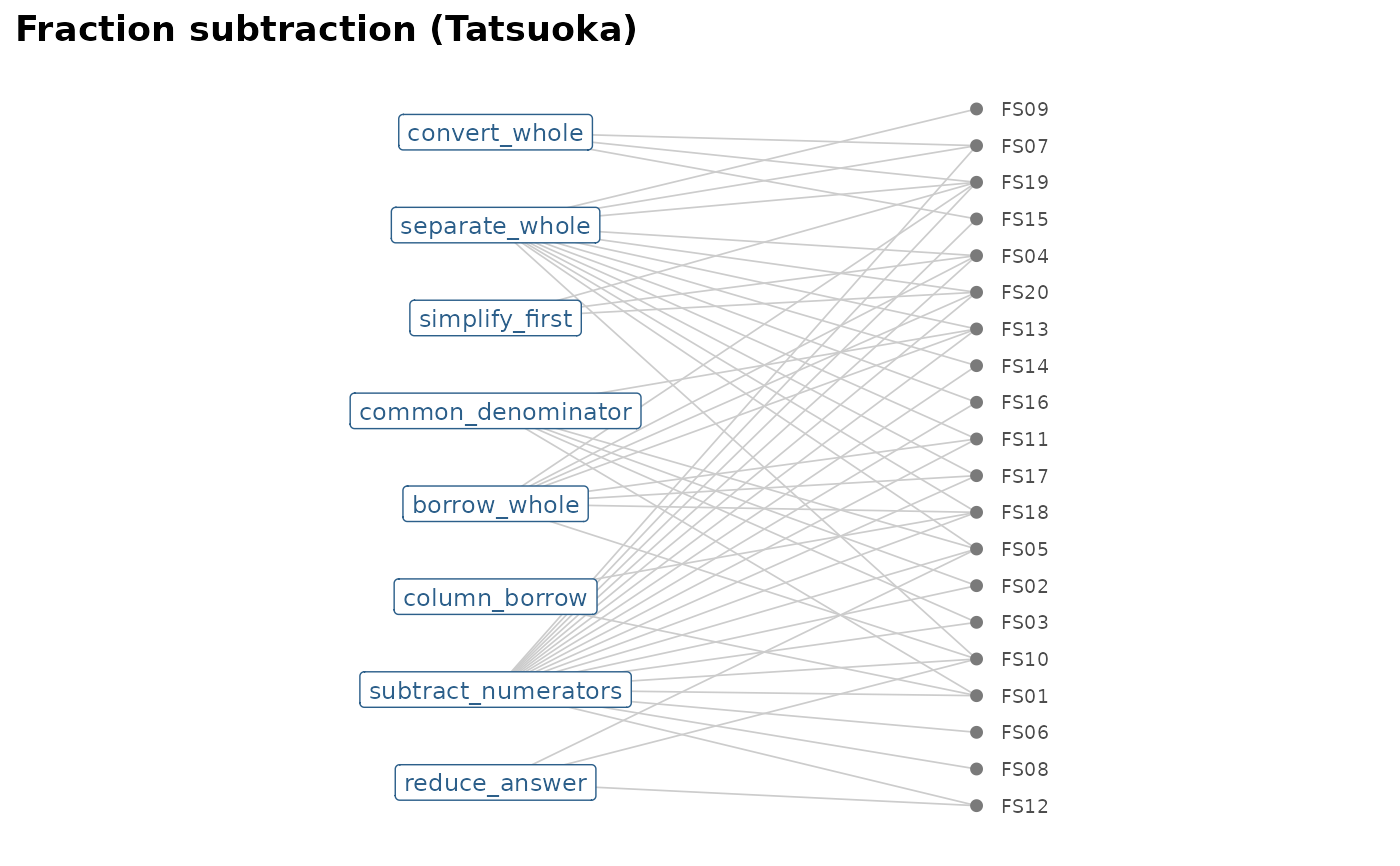
Draws concepts in columns by their place in the learning order: Concepts with no prerequisites on the left, and each prerequisite arrow pointing to the right. Related concepts are joined by dashed lines. Items, when shown, sit in a column on the right, joined to the concepts they measure.
Usage
gg_kg(
  kg,
  items = NULL,
  labels = c("label", "node"),
  highlight = NULL,
  colour = NULL
)
Arguments
- kg
a knowledge graph from
mv_kg_build()oras_mv_kg().- items
logical; draw the items. Defaults to
TRUEwhen the graph has 40 or fewer items.- labels
"label"to print concept labels or"node"for the short concept names.- highlight
optional concepts or items to draw in the accent colour, for example the concepts flagged by
mv_kg_check().- colour
optional name of an item metadata column (see
mv_kg_annotate()) to colour the items by, such as their format or word count.