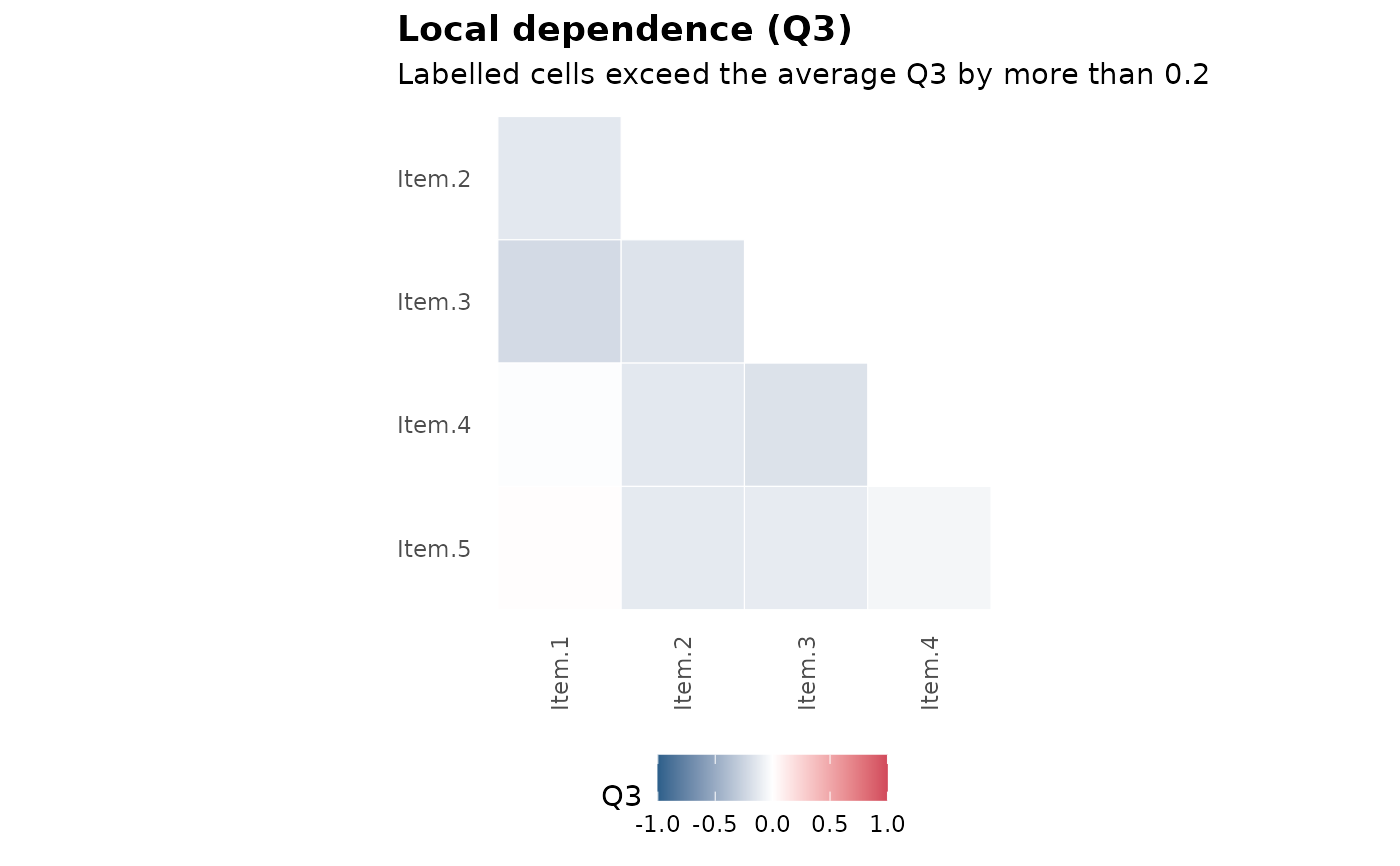
Local dependence heatmap (Yen's Q3)
Arguments
- x
a model returned by
mirt::mirt().- cutoff
absolute residual correlation above the average Q3 that is marked as possible local dependence (0.2 by default, Christensen et al., 2017).
- label
logical; print values in flagged cells.
Examples
mod <- mirt(expand.table(LSAT7), 1, verbose = FALSE)
gg_q3(mod)